Processed Data Summary
This section outlines the statistical data computations compiled directly from our spreadsheet metrics, capturing demographic groupings, age intervals, and key safety parameters.
| Processed Data | |||||||||
|---|---|---|---|---|---|---|---|---|---|
| Total Men Below 50 | 3 | Average Age | 51 | Water trust Scale of 1-5 | Average Female Age | 49 | Open cells/Unanswered | 2 | |
| Total Female Below 50 | 4 | Least Value | 1 | Average Male Age | 52 | ||||
| Total Men Above 50 | 8 | Highest Value | 5 | ||||||
| Total Female Above 50 | 6 | Median Age | 52 | Average Choice | 3 | ||||
| Total | 21 | ||||||||
Visual Data Representation
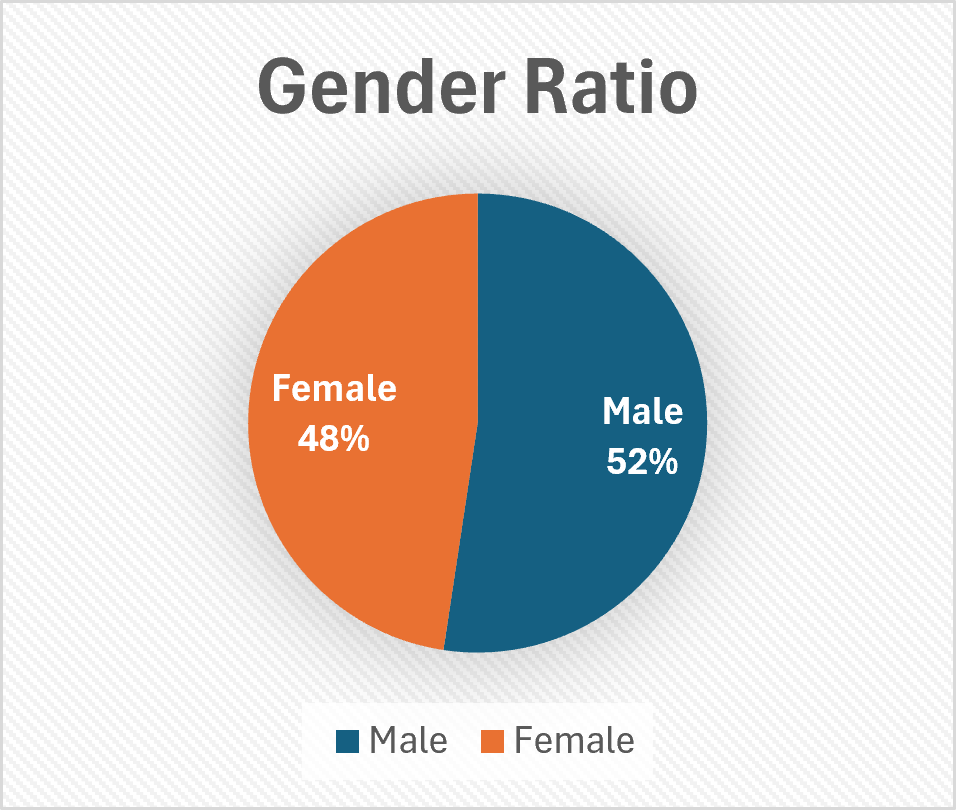
The chart below displays the proportional distribution of survey participants by gender group context.
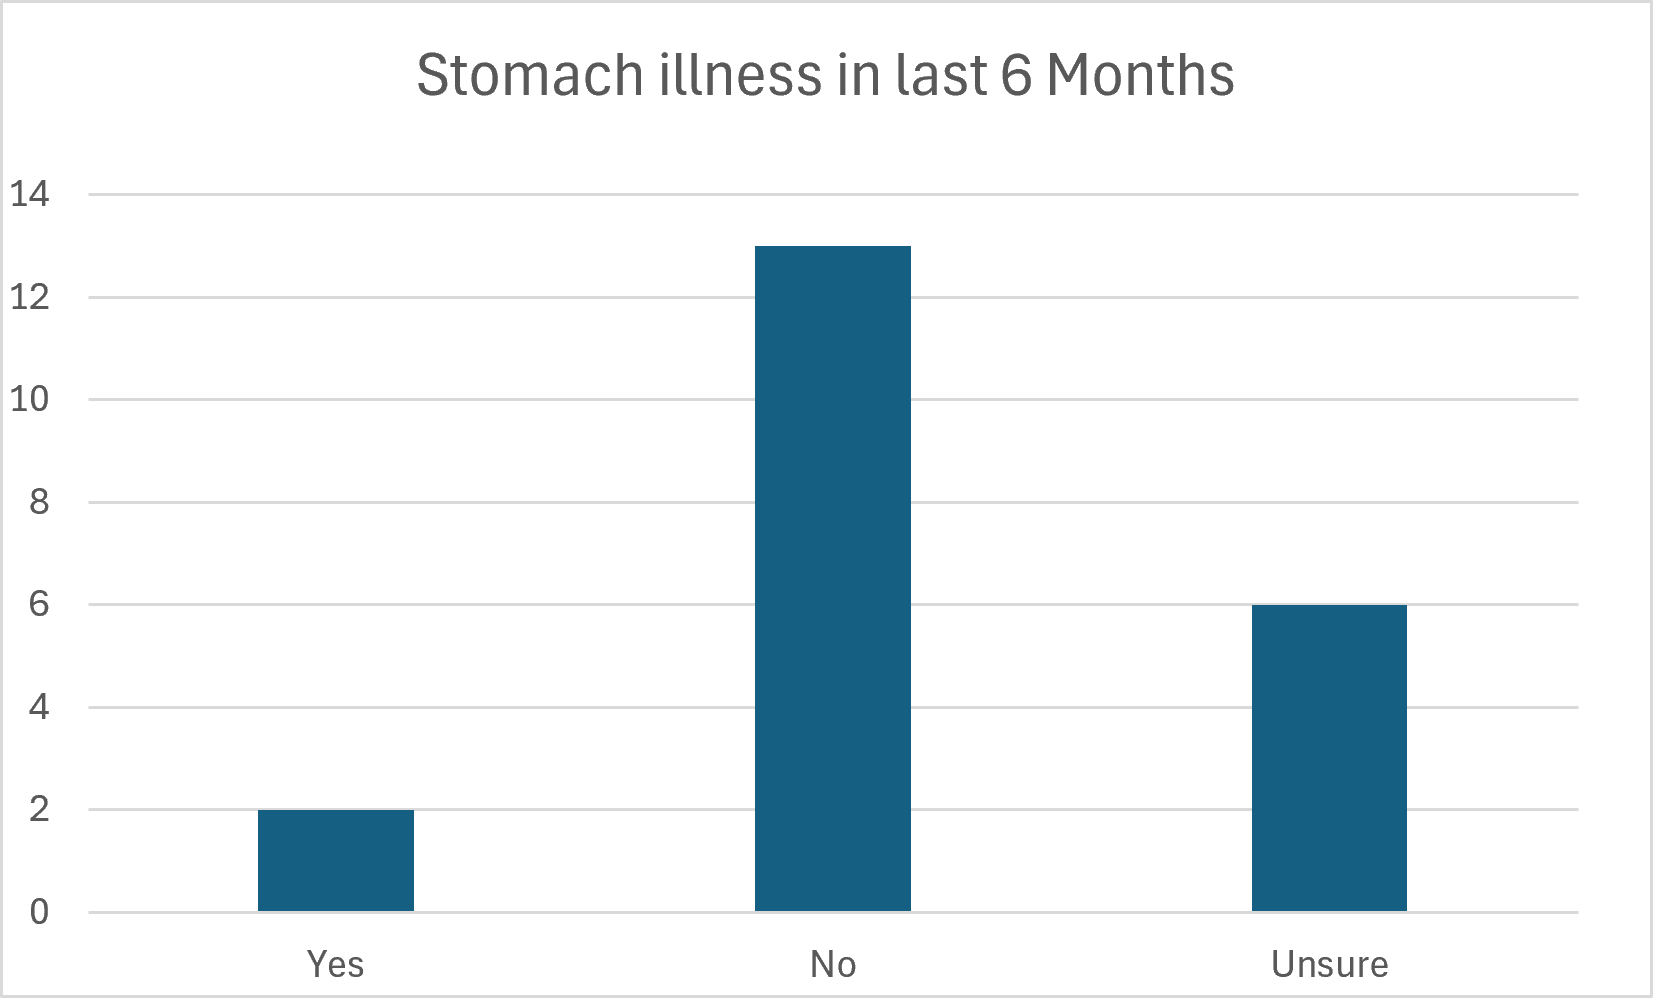
The chart below displays the results of people who had a stomach illness recently.